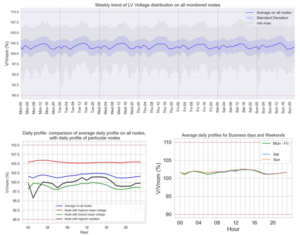
In a recent round of depsys’ distribution grid health checks, more than 50 per cent of customers discovered critical points in their networks they were previously unaware of, including loading, voltage and power quality issues.
Headquartered in Puidoux, Switzerland, depsys has 40 Distribution System Operators (DSOs) customers around the world and has extended its free quarterly Health Check reports to all of them after launching the service in Q1 this year on behalf of seven customers.
Emilie Zermatten, Technical Account Manager at depsys, explained: “The critical points clients found from the health checks varied in severity, but no doubt represented problems that needed to be addressed.
“For example, we were able to show one client that their network frequently experienced dips under certain weather conditions, which was an indicator that equipment might need replacing. Our goal here is to make life simpler for DSOs.”

These reports are being shared at operational and executive level within the grid operators, helping to accelerate digitalisation throughout the utilities.
Using real network data collected by its GridEye grid monitoring and analytics solution, depsys has analysed its customers’ networks to highlight trends, anomalies and outliers, delivering individual reports that are intended to help grid operators to better understand and manage electricity distribution networks with confidence.
Anja Langer Jacquin, Chief Commercial Officer at depsys, commented on the expansion: “One of the key bits of feedback we’ve had is that the Health Checks are seen as a valuable way for executives to tell how healthy their grids are at a glance without having to spend time wading through the detail. It’s like Google Analytics for DSOs.”
Report details for each grid operator:
- Provides overview of both voltage and loading for the last quarter
- Focuses on devices (transformers and cabinets) with extreme performance (highest and lowest values on average over the period of time)
- Pinpoints nodes close or above their voltage limit (+/-10%), or close to 100% loading
- Shows the stability or instability of certain nodes (high loading/high voltage on few points)
- Highlights nodes with a high number of power quality events